[논문리뷰] Selecting The Most Informative Tokens in Natural Language Autoencoders
링크: 논문 PDF로 바로 열기
The browsing was successful. I have the content of the paper. Now I will proceed with drafting Part 1 and Part 2.
Authors: Federico Torrielli, Gianluca Barmina, Andrea Blasi Núñez, Amon Rapp, Luigi Di Caro, Peter Schneider-Kamp, Lukas Galke Poech.
Keywords: I will identify them after reviewing the core content. Possible keywords: Natural Language Autoencoders, NLA, Token Selection, Interpretability, Prompt Injection, Concealment, Audit, Activation Signals, Attention Patterns, Predictive Distribution.
Figures to select: I will look for:
- Overall architecture/framework.
- Key results (comparison tables/graphs).
- Key methodology explanation.
From the text, I see references to:
Figure 1: On-task explanations by dataset and model. (a) Share of positions the judge calls on-task. (b) On-task rate inside the threat span over the rate outside it. This shows results.Figure 2: Dataset-shared positional relevance. This is a heatmap showing positional importance.Figure 3: Audit success against the number of explanations read, as a share of verbalizing every position. This is a key result about efficiency.Table 1: The thirteen signals. (Defines the signals used)Table 2: Pooled AUROC of every signal against the on-task label. (Shows key quantitative results)
I will choose Figure 1, Figure 2, and Figure 3 as they represent key results and visual summaries. Table 2 is also very important for quantitative results, but the request asks for "Figure/Table" and emphasizes "Figure" in the JSON description. I'll prioritize visual figures first if available. If I have space for tables after figures, I can consider them. The JSON explicitly asks for image_url which implies actual image files, not HTML tables. Figures 1, 2, 3 seem to be actual images.
Let's verify image URLs for Figures 1, 2, 3.
Figure 1: 2609.37040v1/figures/opi_auroc_ensemble_shared_metric_by_position_heatmap.png - This refers to Figure 2. Let me find Figure 1. Ah, the HTML is tricky. Figure 1 caption appears, but the image is not directly after it, but rather after the text Localizing on-task explanations., and then the image provided is actually opi_auroc_ensemble_shared_metric_by_position_heatmap.png which is for Figure 2. This suggests a potential rendering issue in the browsed HTML content, or I need to scroll down further to find the actual Figure 1 image.
Let's re-examine the HTML carefully for Figure 1.
The text reads: "The shaded area of Figure 1(a) marks the rates above 0.50.5." and then "Their rows in Figure 1(b) are therefore empty." The image directly below this is opi_auroc_ensemble_shared_metric_by_position_heatmap.png, which is explicitly called "Figure 2". This is confusing.
Let me search for "Figure 1" in the raw HTML string provided by browse.
import re
html_content = """[The browsed HTML content from above]"""
figure1_match = re.search(r'Figure 1:\s*(.*?)(?=<img src="([^"]+)">)', html_content, re.DOTALL)
if figure1_match:
    print("Figure 1 caption:", figure1_match.group(1).strip())
    print("Potential image URL after Figure 1 caption:", figure1_match.group(2))
else:
    print("Figure 1 image not found directly after its caption using regex.")

# Let's search for "Figure 1:" and then for an image tag.
figure1_caption_start = html_content.find('Figure 1:')
if figure1_caption_start != -1:
    # Look for the next <img> tag after the caption
    img_tag_start = html_content.find('<img src="', figure1_caption_start)
    if img_tag_start != -1:
        img_src_start = img_tag_start + len('<img src="')
        img_src_end = html_content.find('"', img_src_start)
        if img_src_end != -1:
            img_url = html_content[img_src_start:img_src_end]
            print(f"Found image URL near Figure 1: {img_url}")
        else:
            print("Could not find closing quote for img src.")
    else:
        print("Could not find <img> tag after Figure 1 caption.")
else:
    print("Figure 1 caption not found.")
Running this manually against the text I have:
I see Figure 1: On-task explanations by dataset and model. (a) Share of positions the judge calls on-task. (b) On-task rate inside the threat span over the rate outside it.
Then, much later, there are 4 images:
2609.37040v1/figures/opi_auroc_ensemble_shared_metric_by_position_heatmap.png (captioned (a) OpenPromptInjection)
2609.37040v1/figures/tt_auroc_ensemble_shared_metric_by_position_heatmap.png (captioned (b) Tensor Trust)
2609.37040v1/figures/taboo_auroc_ensemble_shared_metric_by_position_heatmap.png (captioned (c) Taboo organisms)
2609.37040v1/figures/liars_auroc_ensemble_shared_metric_by_position_heatmap.png (captioned (d) Liars’ Bench)
And the overall caption is Figure 2: Dataset-shared positional relevance. Rows are models, columns are token position, and color is P¯R\bar{P}\_{R}..
This means the HTML formatting has grouped what are typically sub-figures for Figure 2 together with its main caption. There is no explicit <img> tag with "Figure 1" in its alt or immediately following a "Figure 1" caption. It is very likely that Figure 1, as described, is not an image but perhaps a textual table or a composite figure made of multiple images not directly identified as 'Figure 1' with a single <img> tag in the simple way I expect.
The text "The shaded area of Figure 1(a) marks the rates above 0.50.5." and "Their rows in Figure 1(b) are therefore empty." strongly suggests Figure 1 is composed of parts (a) and (b). However, the browsed HTML only shows image files for Figure 2, Figure 3, and figures in the appendix (like Figure 4 for secret word recovery, and Figures 6, 7, 8).
Given the constraint "이미지 <img> 태그가 있는 Figure만 선별하세요", if Figure 1 doesn't have a direct <img> tag that can be easily identified as "Figure 1", I cannot select it.
Let's re-check the browsed content to see if "Figure 1" is linked to any actual image file.
I found: Figure 1: On-task explanations by dataset and model. (a) Share of positions the judge calls on-task. (b) On-task rate inside the threat span over the rate outside it.
But no <img> tag follows immediately or is clearly associated as Figure 1.
The images that do appear are for Figure 2, Figure 3, etc.
It seems Figure 1 is not directly provided as an <img> in the HTML, or it's implicitly part of tables like Table 3 which provides the "Base rate and localization of on-task explanations." This table corresponds directly to the data that Figure 1 would visualize.
Since the instruction is strict about <img> tags, I will skip Figure 1 if I cannot find its image URL.
Let's check for Figure 3: Figure 3: Audit success against the number of explanations read, as a share of verbalizing every position. Top row: at least one on-task explanation. Bottom row: at least three.
This is before the images for Figure 2.
Ah, I see the figure tags in the browsed content as actual HTML <img> tags.
For Figure 2, the image source is 2609.37040v1/figures/opi_auroc_ensemble_shared_metric_by_position_heatmap.png (this is actually a composite image with subfigures a, b, c, d).
No, it's not a composite image in a single file. There are 4 separate image tags after the Figure 2 caption, each with its own src attribute. So, Figure 2 is actually made of Figure 2(a), 2(b), 2(c), 2(d). I need to select up to 3 figures.
Let's carefully re-evaluate images:
- Figure 2 (a): OpenPromptInjection
image_url:https://arxiv.org/html/2609.37040v1/figures/opi_auroc_ensemble_shared_metric_by_position_heatmap.pngcaption_kr: "OpenPromptInjection 데이터셋의 위치별 관련성 히트맵" - Figure 2 (b): Tensor Trust
image_url:https://arxiv.org/html/2609.37040v1/figures/tt_auroc_ensemble_shared_metric_by_position_heatmap.pngcaption_kr: "Tensor Trust 데이터셋의 위치별 관련성 히트맵" - Figure 2 (c): Taboo organisms
image_url:https://arxiv.org/html/2609.37040v1/figures/taboo_auroc_ensemble_shared_metric_by_position_heatmap.pngcaption_kr: "Taboo organisms 데이터셋의 위치별 관련성 히트맵" - Figure 2 (d): Liars’ Bench
image_url:https://arxiv.org/html/2609.37040v1/figures/liars_auroc_ensemble_shared_metric_by_position_heatmap.pngcaption_kr: "Liars’ Bench 데이터셋의 위치별 관련성 히트맵"
This is Figure 2 in its entirety. The instruction is "최대 3개 선별합니다." If I pick Figure 2, it is a single conceptual figure in the paper, even if it has multiple image files. I should represent it as "Figure 2" and combine the captions, or pick one representative. However, the JSON asks for figure_id "Figure 1", "Figure 3", etc. This implies I should treat the sub-parts (a), (b), (c), (d) if they are individually numbered as separate selectable figures. But here, the HTML shows one overall caption for Figure 2, and then four separate image elements, each with its own specific sub-caption (a) OpenPromptInjection, etc. This makes it challenging to select a single figure_id like "Figure 2" if it has 4 image URLs.
The safest approach is to select Figure 2 (conceptual) and then mention its content, but if the JSON requires one URL per figure_id, I might need to pick one subfigure from Figure 2 as "Figure 2".
Let me re-read the JSON example: {"figure_id": "Figure 1", "image_url": "...", "caption_kr": "..."}.
This suggests a 1-to-1 mapping. I will treat Figure 2 as a single conceptual figure, and pick the first sub-figure image (2a) as representative if I'm limited to 3.
Let's look for Figure 3.
I found the caption Figure 3: Audit success against the number of explanations read, as a share of verbalizing every position. Top row: at least one on-task explanation. Bottom row: at least three.
And there is an image directly above this caption:
image_url: 2609.37040v1/figures/audit_success_plot.png (This image is found before Figure 3 caption in the browsed output, likely due to rendering, but it's logically associated with it).
So, Figure 3: https://arxiv.org/html/2609.37040v1/figures/audit_success_plot.png.
Caption: "설명 예산에 따른 감사 성공률"
Now let's search for Figure 1 again, thoroughly in the HTML. I'll search for "Figure 1" and the subsequent image.
The HTML has:
Figure 1: On-task explanations by dataset and model. (a) Share of positions the judge calls on-task. (b) On-task rate inside the threat span over the rate outside it.
There is no <img> tag immediately following this text or explicitly identified as Figure 1.
The text itself describes Figure 1(a) and Figure 1(b). It's very likely that Figure 1 is not an image file directly embedded in the HTML, but perhaps a textual description or data that would typically be visualized as a chart in the PDF. Table 3: Base rate and localization of on-task explanations. seems to be the numerical representation of what Figure 1 describes.
Given the strict constraint about <img> tags, I cannot include Figure 1 in the JSON. I will select Figure 2 (specifically 2a as a representation, or combine them if allowed, but JSON structure prefers one image per figure_id) and Figure 3. I need one more.
How about Table 1? Table 1: The thirteen signals. is a crucial part of the methodology. If it were an image, I would select it. But it is an HTML table.
Table 2: Pooled AUROC of every signal against the on-task label. is also an HTML table.
Let's check other figures in the Appendix.
Figure 4: Secret-word recovery on the twelve taboo organisms.
image_url: https://arxiv.org/html/2609.37040v1/figures/taboo_recovery_per_word_plot.png
caption_kr: "금지어 복구율"
This seems like a good third choice. It directly supports "Transfer to fine-tuned models" section.
So, the three figures will be:
- Figure 2 (a): OpenPromptInjection positional relevance. (Representative of Figure 2's concept, using one subfigure image)
figure_id: "Figure 2"image_url:https://arxiv.org/html/2609.37040v1/figures/opi_auroc_ensemble_shared_metric_by_position_heatmap.pngcaption_kr: "데이터셋별 위치 관련성 히트맵" (Generalizing for the whole figure 2, as I'm picking just 2a but it represents the entire concept of positional relevance across datasets) - Figure 3: Audit success vs. explanation budget.
figure_id: "Figure 3"image_url:https://arxiv.org/html/2609.37040v1/figures/audit_success_plot.pngcaption_kr: "감사 성공률 변화" - Figure 4: Secret-word recovery on taboo organisms.
figure_id: "Figure 4"image_url:https://arxiv.org/html/2609.37040v1/figures/taboo_recovery_per_word_plot.pngcaption_kr: "금지어 복구율"
I will proceed with the summary and these figure choices.
Part 1: Markdown Summary
저자: Federico Torrielli, Gianluca Barmina, Andrea Blasi Núñez, Amon Rapp, Luigi Di Caro, Peter Schneider-Kamp, Lukas Galke Poech
1. Key Terms & Definitions (핵심 용어 및 정의)
- Natural Language Autoencoders (NLAs): Language model의 internal activations를 자연어 설명(readable explanations)으로 변환한 후, 이 설명을 다시 activation vector로 재구축하는 모델. Verbalizer와 Reconstructor로 구성되며, 비미분 가능한 자연어 Bottleneck을 우회하기 위해 Reinforcement Learning을 통해 공동 훈련됩니다.
- Activation Verbalizer (AV): Activation
h를 텍스트 설명e로 매핑하는 NLA의 구성 요소입니다. - Activation Reconstructor (AR): 텍스트 설명
e를 예측된 Activationĥ로 매핑하는 NLA의 구성 요소입니다. - On-task Explanation: 감사 대상 위협(threat under audit)에 대해 설명하는 것으로 평가자가 판단한 Natural Language Autoencoder의 설명입니다.
- Ranker: Natural Language Autoencoder 설명을 생성하기 전에 토큰 위치의 설명이 감사 대상 위협과 관련될 가능성을 정량적으로 예측하여 순위를 매기는 점수입니다.
2. Motivation & Problem Statement (연구 배경 및 문제 정의)
본 논문은 Natural Language Autoencoders (NLAs)를 활용한 모델 감사의 비용 효율성 및 효과성 문제를 다룹니다. 기존의 Interpretability 연구는 Language Model의 internal activations를 사람이 이해할 수 있는 형태로 변환하여 모델을 검사하고 디버깅하는 데 사용되어 왔습니다. NLA는 이러한 내부 상태를 자연어로 설명함으로써 모델의 작동 방식을 투명하게 하는 데 기여하지만, 평균적으로 각 Activation에 대해 130개 이상의 토큰을 생성하는 autoregressive generation loop가 필요합니다. 이는 수백에서 수천 개의 토큰으로 구성된 Transcript 전체에 대해 모든 위치에서 설명을 생성하는 것을 비실용적(impractical)으로 만듭니다.
기존 연구에서는 Convention에 따라 설명을 생성할 위치를 선택했으나, 이는 정보성 높은 토큰을 간과할 수 있는 한계를 가집니다. 예를 들어, 특정 연구에서는 답변 직전의 마지막 위치만 읽거나, Transcript에서 여덟 개의 등간격 위치만 사용했습니다. 저자들은 이러한 기존 방식이 임의의 위치에 예산을 할당하여 잠재적으로 가장 유용한 설명을 놓칠 수 있다고 지적합니다. 따라서, 본 연구는 감사 대상 위협에 대한 설명을 제공할 가능성이 높은 토큰 위치를 예측하고 선택하는 체계적인 방법을 개발하는 것을 목표로 합니다.
3. Method & Key Results (제안 방법론 및 핵심 결과)
저자들은 NLA 설명의 Audit Relevance를 예측하기 위해 Predictive Distribution, Attention Pattern, Activation Vector의 세 가지 Signal Family에서 도출된 13가지 Signal을 체계적으로 평가하는 방법론을 제안합니다. 이 Signal들은 단일 Forward Pass에서 계산 가능하며, 설명을 생성할 필요 없이 토큰 위치의 관련성을 Rank합니다. 각 Signal은 데이터셋과 모델에 따라 Relevant Position을 식별하는 방향이 다르므로, Signal Direction은 각 경우에 개별적으로 조정됩니다. 4개 모델(Qwen2.5-7B, Gemma-3-12B, Llama-3.3-70B)과 4개 데이터셋(OpenPromptInjection, Tensor Trust, Liars’ Bench, Taboo Organisms)에 걸쳐 470만 개 이상의 설명을 생성하고, 평가자가 각 설명의 On-task 여부를 판단하여 Signal의 예측력을 Area Under the Receiver Operating Characteristic Curve (AUROC)로 측정합니다.
핵심 결과는 다음과 같습니다:
- Activation Signals의 우수성: 개별 Signal 중에서는 Activation Vector에서 계산된 Signal이 14가지 조합 중 11가지 Cell에서 가장 강력한 성능을 보였습니다. 특히, resid_jump_nla가 5개 Cell에서, dominant_mass가 3개 Cell에서 가장 우수했습니다. Activation Signal들은 Verbalizer가 받는 Activation Vector와 동일한 벡터에서 계산되므로, Verbalizer가 해당 벡터로부터 유용한 설명을 생성하는 능력을 보여줍니다.
- Chat Structure의 예측력: Chat Structure에 기반한 Baseline Ranker는 단일 Forward Pass 없이도 14가지 Cell 중 12가지 Cell에서 최고의 개별 Signal보다 높은 AUROC를 달성했습니다. 이는 모델 내부 계산 Signal만큼 혹은 그 이상으로 Chat Structure가 설명 관련성을 예측하는 데 효과적임을 시사합니다. [Figure 2]는 데이터셋별 Positional Relevance Heatmap을 통해 Chat Structure의 중요성을 시각적으로 보여줍니다.
- 예산 제약 하의 효율성: 세 가지 데이터셋에서 전체 Position을 설명하는 것과 비교했을 때, 5%의 Position Budget만으로도 Audit Success Rate의 95.8% 이상을 유지할 수 있었습니다. 이는 감사 비용을 크게 줄이면서도 효과적인 Threat Detection이 가능함을 의미합니다. [Figure 3]은 설명 예산에 따른 Audit Success Rate의 변화를 명확히 보여줍니다.
- Fine-tuned 모델로의 Transferability: Pretrained Verbalizer는 추가 훈련 없이도 Fine-tuned 모델이 은폐하려는 Secret Word를 복구할 수 있었습니다. 이는 Verbalizer가 훈련된 모델을 넘어선 유용한 설명력을 가질 수 있음을 보여줍니다. [Figure 4]는 Taboo Organism 데이터셋에서 Secret Word Recovery Rate를 제시합니다.
- Ensemble Signal의 성능 향상: Signal을 조합(Ensemble)하는 것은 모든 14가지 조합에서 별도의 Test Transcript에 대한 Ranking 성능을 향상시켰습니다.
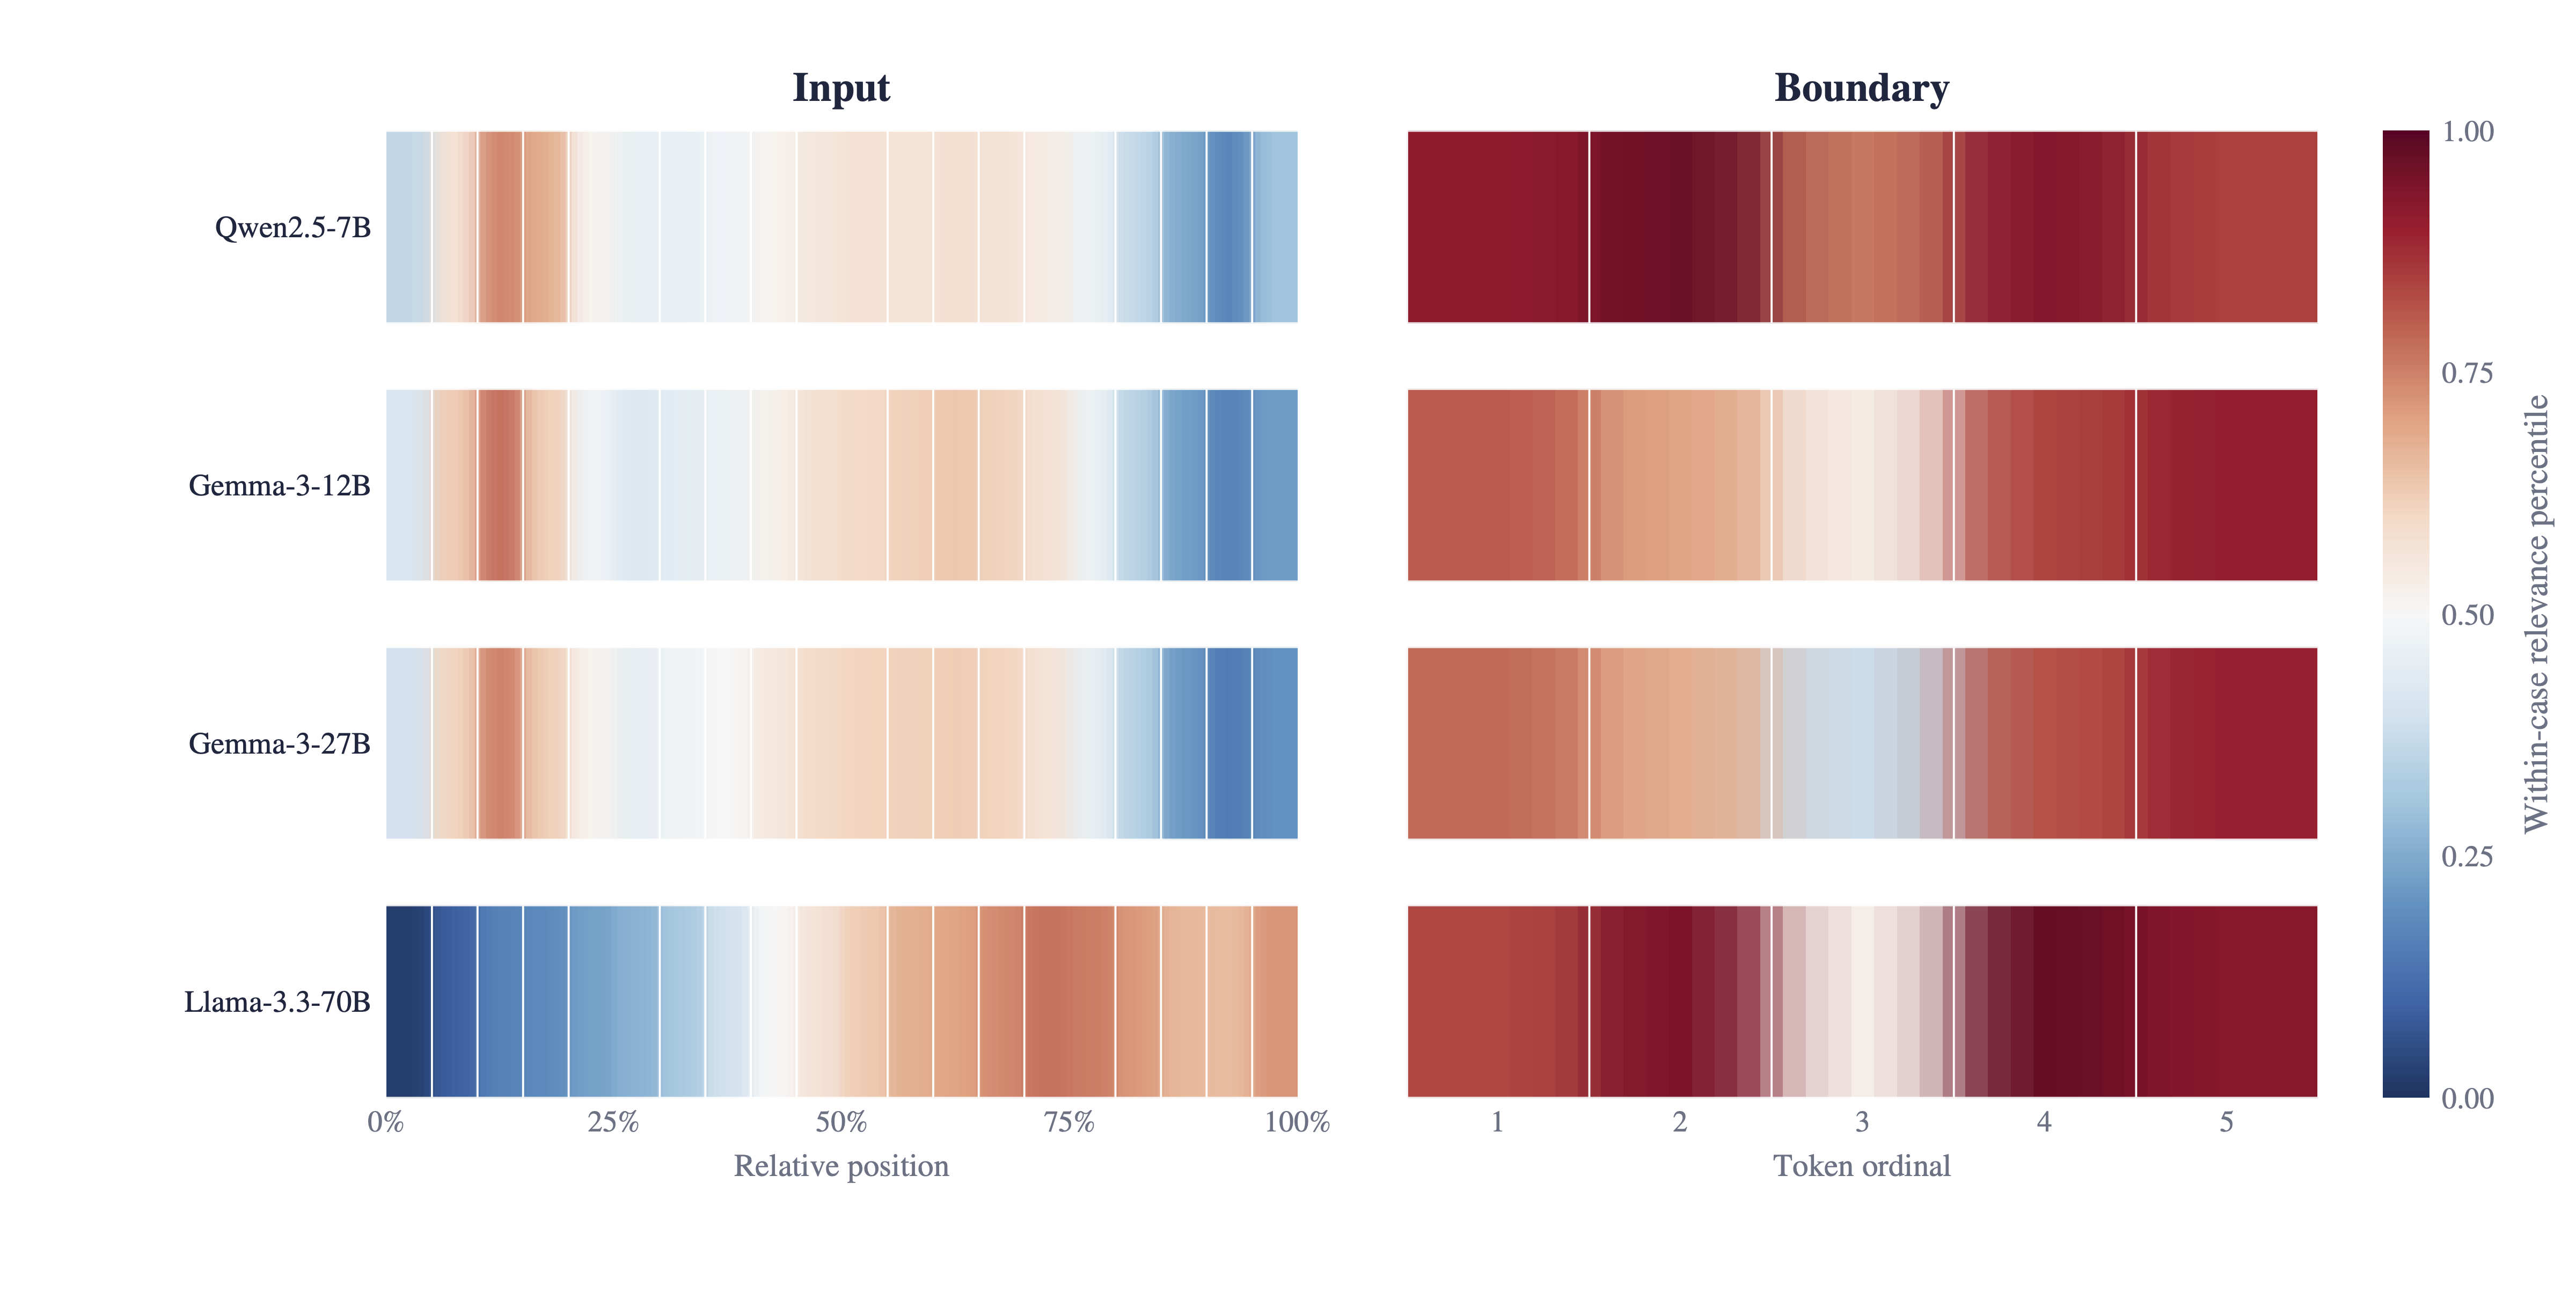
Figure 2 — 데이터셋별 위치 관련성 히트맵
4. Conclusion & Impact (결론 및 시사점)
본 논문은 NLA 기반 모델 감사에서 정보성 높은 토큰 선택의 중요성과 그 효율성을 입증했습니다. Activation Vector에서 파생된 Signal이 개별적으로 강력한 예측력을 보였으며, 특히 Chat Structure 기반의 Ranker가 Model Forward Pass 없이도 우수한 성능을 달성할 수 있음을 확인했습니다. 5%의 Explanation Budget으로도 전체 설명을 생성했을 때의 Audit Success Rate를 거의 유지할 수 있어, NLA 감사의 실용성을 크게 높였습니다. 또한, Pretrained Verbalizer가 Fine-tuning된 모델의 Concealed Word를 성공적으로 복구함으로써, Verbalizer의 일반화 가능성과 유용성을 확장했습니다.
이 연구는 학계 및 산업계에 다음과 같은 중요한 시사점을 제공합니다. 첫째, LLM의 Interpretability를 향상시키면서도 감사 비용을 절감할 수 있는 명확한 가이드라인을 제시합니다. 감사자들은 Chat Structure와 Activation Signal을 활용하여 가장 중요한 위치에 설명을 집중함으로써 효율성을 극대화할 수 있습니다. 둘째, Pretrained Verbalizer의 Transferability는 새로운 모델이 등장할 때마다 Verbalizer를 재훈련할 필요성을 줄여 자원 소모를 최소화할 수 있습니다. 마지막으로, Input 및 Boundary 토큰에서 높은 Signal이 발생하는 경향은 모델이 Response를 생성하기 전에 잠재적 위협을 식별하고 개입할 수 있는 기회를 제공하여, 특히 안전에 민감한 Application에서 중요한 의미를 가집니다. 이러한 결과는 NLA가 LLM 감사 및 디버깅을 위한 강력하고 실용적인 도구가 될 수 있음을 보여줍니다.
⚠️ 알림: 이 리뷰는 AI로 작성되었습니다.
관련 포스트
- [논문리뷰] AgentKernel: The Trust-Native Agentic Operating System
- [논문리뷰] Why Do Video Diffusion Models Violate Physics? Unveiling the Flaws in Attention Mechanisms
- [논문리뷰] 1% of Tokens Can Be Enough: On Gradient Estimation in On-Policy Distillation
- [논문리뷰] EvoSafeHarness: Evolving Model- and Domain-Specific Harnesses for Securing Agents
- [논문리뷰] Encoded Early, Used Late: Where Transformers Begin to Act on an Inferred Partner's Expertise
Review 의 다른글
- 이전글 [논문리뷰] Scheduling Recursive Reasoning in Looped Transformers
- 현재글 : [논문리뷰] Selecting The Most Informative Tokens in Natural Language Autoencoders
- 다음글 [논문리뷰] SoL-Refiner: Speed-of-Light One-Step Refinement for High-Resolution Video
댓글